Weekly Paper Notes — one of the top picks from the 2026-08-22 CS paper digest. Area: Operating Systems / Serving Systems.
Authors: Chaokun Chang, Yukun Zhou, Kaihua Fu, Dakai An, Tianyu Feng, Hanfeng Lu, Sheng Yao, Pu Guo (HKUST), Yinghao Yu (Alibaba Group), Yizhou Shan (ByteDance), Bo Li, Binhang Yuan, Wei Wang (HKUST) arXiv: 2608.15127 · PDF
TL;DR
Every serving system in production today — vLLM, SGLang, TensorRT-LLM — was designed around a single assumption: the unit of work is a token-generation request, and the GPU is where the time goes. This paper is the first study to instrument a broad set of agentic applications under a unified, controllable serving stack and check whether that assumption still holds. It does not.
AgentSysBench assembles ten representative agentic applications (RAG, HuggingGPT, DeepResearch, WebAgent, GUIAgent, Claude Code, Codex, Mini-SWE, an Openclaw-like assistant, and Pi-AutoR), wraps them in unified systems-level instrumentation, and runs them across controlled deployments plus production traces: 4,641 benchmark requests, 64,924 LLM calls, 118,274 tool calls, and 178,799 production sessions from a single day. Six properties fall out, and they are uncomfortable ones for anybody who has built an inference server. Non-LLM components dominate latency in 5 of 10 applications. Sandbox working-set memory peaks at 28 GB per session. Task latencies within a single application diverge by up to 32×. Production sessions sit idle but live — holding KV cache, conversation history, and a running container — for minutes to hours. And 27% of unique search queries in a production agentic-search trace account for 67.3% of all search API calls.
The paper doesn’t stop at measurement. Four proof-of-concept design explorations, each derived from one finding, deliver 29–40% latency reduction, up to 4.5× end-to-end speedup, 4.6× memory reduction, and elimination of 35.2% of redundant search calls. The claim is that current workload-oblivious serving leaves an enormous amount of efficiency unclaimed — and the evidence is hard to argue with.
What problem is the paper actually attacking?
There is a genuine gap in the literature here, and the paper is precise about its shape. Three bodies of work exist, and each controls exactly one side of a two-sided problem.
Capability benchmarks — SWE-bench, AgentBench, WebArena, OSWorld, ToolBench — provide realistic tasks and environments, and measure task completion. What they don’t record is anything a systems person needs: no latency breakdown, no resource profile, no state footprint, no token accounting. They run on an implicit, uncontrolled serving stack. You learn whether the agent solved the bug; you learn nothing about where the 90 seconds went.
Agent-serving systems take the opposite cut. Each varies serving mechanisms — scheduling, batching, placement — but evaluates on one to three workflows under incompatible assumptions about requests, tools, models, and orchestration. Their observations are point solutions. You cannot tell which properties are fundamental to agentic execution and which are artifacts of the one workflow that was measured.
Recent measurement studies come closest, instrumenting ReAct-style traces, CPU-side orchestration overhead, and dynamic reasoning cost. But each runs on a single fixed serving stack. A reported bottleneck may be entirely specific to that stack’s model engine, tool implementation, hardware allocation, or placement policy.
The authors formalize why this matters with a model that is the conceptual heart of the paper. They write the serving system as $S = \langle H, C, A \rangle$ — hardware resources $H$ (GPUs, CPUs, DRAM, storage, network bandwidth), component-serving mechanisms $C$ (how the LLM engine, embedding service, vector database, sandbox manager, browser environment, and coordinator are each served), and deployment architecture $A$ (co-located, separately containerized, or remote cloud). A measured outcome is then an interaction:
$$Y = \Phi(W, S)$$
where $W$ is the workload. This is not notation for its own sake. It expresses the failure mode directly: the same application can appear LLM-dominated with a slow model, tool-dominated with a slow sandbox, state-dominated with a large live context, or network-dominated with remote placement. If you underspecify the serving stack, you attribute to the workload a bottleneck that was actually caused by your hardware allocation. If you underspecify the workload, you tune an optimization to one configuration with no evidence it generalizes.
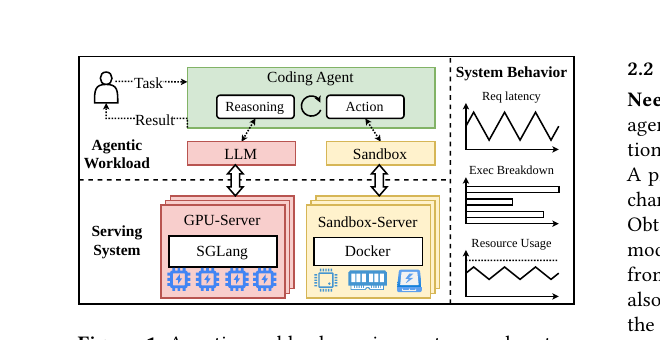
The single observation that motivates everything else: agentic behavior cannot be characterized from the workload alone. You must control both sides simultaneously. That is what AgentSysBench is built to do.
The mechanism: a modular serving stack with unified instrumentation
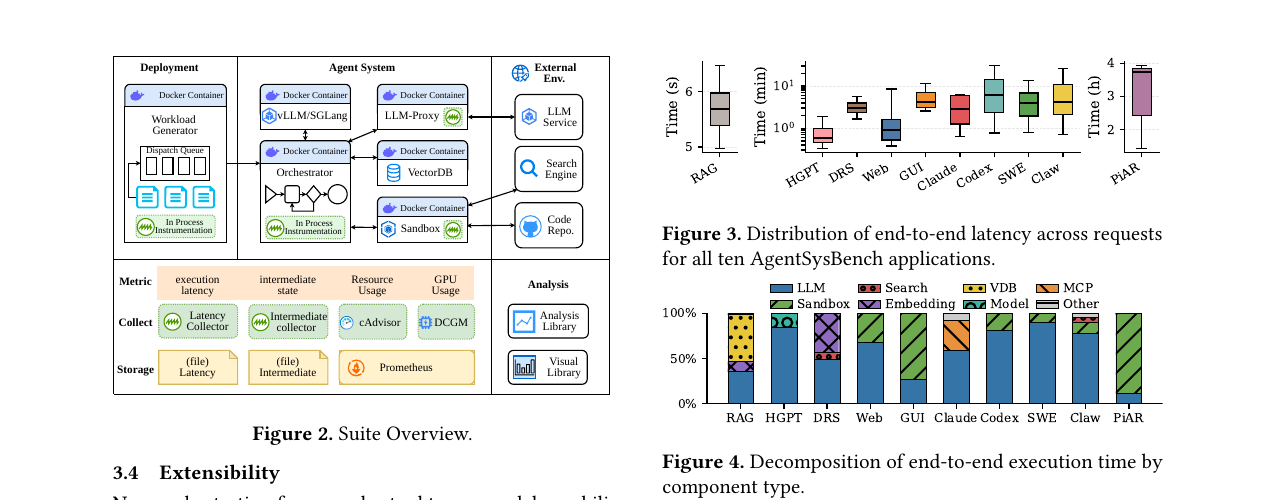
AgentSysBench has three components, and the third is the one that makes the study possible.
First, the suite: ten applications chosen to span the execution patterns that shape systems behavior — predefined versus LLM-driven control flow, diverse tool and environment interaction, and long-running stateful execution. The domains cover QA (RAG), multimodal processing (HuggingGPT), terminal use (Codex), computer use (GUIAgent), office work (an Openclaw-like assistant), AI search (DeepResearch), software engineering (Mini-SWE), browser use (WebAgent), tool-rich assistants (Claude Code), and autonomous research (Pi-AutoR).
Second, the harness: unified instrumentation of LLM calls, tool invocations, and state operations, recording latency, resource usage, data movement, live state footprint, token behavior, and cost. Latency and intermediate-state collectors write to file; cAdvisor handles resource usage; DCGM handles GPU usage; everything lands in Prometheus.
Third — and this is the differentiator — a modular serving stack that deploys LLMs, embedding models, vector databases, sandboxes, browser/GUI environments, search services, and tool servers either separately or co-located. Placement becomes a variable, not a fixed assumption. This is what lets the paper separate “this application is tool-bound” from “this application was deployed with its sandbox on a different machine.”

The six findings split cleanly into three from controlled experiments and three that only production traces could reveal.
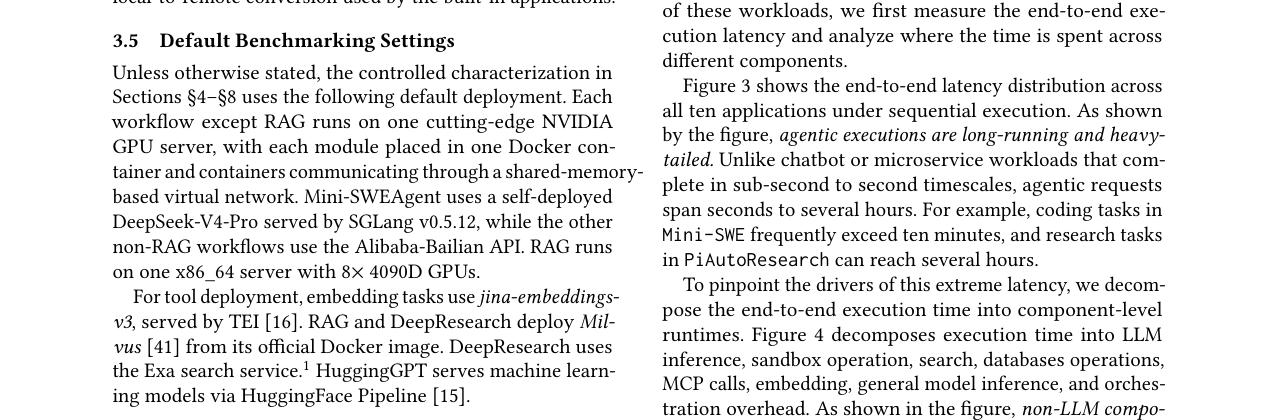
(1) Heavyweight execution with non-LLM dominance. Agent execution is long-running and stateful, issuing many LLM, tool, and environment calls while accumulating live session state — prompts, tool outputs, KV cache, artifacts — for the whole request. In 5 of 10 applications, tools and environments dominate or co-dominate latency. Model-only optimization leaves much of the execution time untouched.
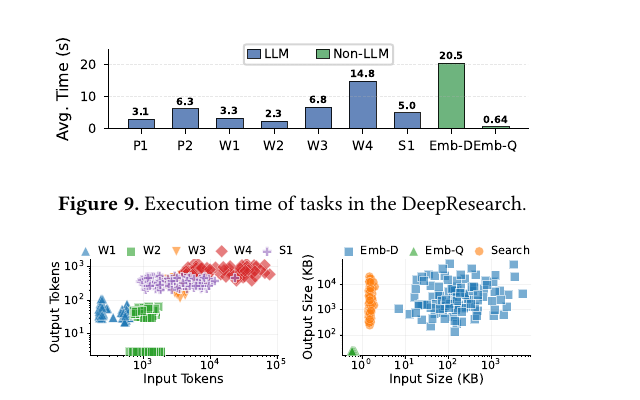
(2) Cross-stack heterogeneity. A single application composes GPU-bound LLMs, memory-bound vector databases, CPU-bound sandboxes, and network-bound services. Even tasks sharing one component differ by up to 32× in latency, causing severe head-of-line blocking under a single queue.
(3) Shifting bottlenecks. The dominant component shifts across requests, models, tools, and deployments. Even a simple RAG pipeline moves its bottleneck between embedding and vector-database operations as inputs change. Application-level averages mask this variance entirely.
(4) Long idle-but-live intervals. Production sessions wait minutes to hours between steps while holding conversational, tool, and environment state — neither finished nor consuming compute. Treating them as live wastes memory and disk; treating them as finished loses resumable state. Serving systems currently have no way to express “waiting” as distinct from “done.”
(5) The LLM control-plane tax. Beyond the productive work of deciding the next action and producing output, tokens are spent on tool schemas, raw observations, and safety checks. This tax grows over multi-step sessions and fills context, raising both latency and cost.
(6) Exploitable cross-request redundancy. Among 373,678 search queries from a production agentic-search application, 27% of unique queries recur and account for 67.3% of all search API calls. In an Openclaw-like application issuing 4,389 web fetches, 24% of distinct URLs recur and account for 64% of fetch invocations. This is completely invisible in single-task benchmarks.
Why the cost model breaks (or: the practical claim)
The latency decomposition is the figure to sit with. Across the ten applications, the share of end-to-end execution time attributable to the LLM varies enormously — and in the tool-heavy applications, sandbox, search, embedding, and vector-database work swallow the majority.
The cost analysis is more pointed still. Estimating per-request pay-as-you-go operating cost under public cloud pricing — LLM APIs priced for cache-read, prefill, and decode; sandbox execution priced at E2B rates; search priced at Firecrawl rates — non-LLM infrastructure charges dominate in tool-heavy applications. In Pi-AutoR, sandbox charges constitute over 99% of per-request cost, driven by GPU-accelerated containers running scientific simulations.
The mechanism behind this cost shift is worth naming explicitly, because it is a pure systems problem rather than a model problem: resource idle time during sequential execution. When a dedicated sandbox or retrieval environment is allocated to a session, it keeps incurring billing charges even while the session waits on a long GPU-bound inference step. Low utilization, high financial waste, and none of it visible to a token-accounting cost model.
The authors’ implication is that cost-aware serving must orchestrate the full tool-use lifecycle — dynamically pausing, snapshotting, and resuming container environments during idle periods, the way serverless platforms handle cold starts. Billing should decouple from session lifetime.
Results: four interventions, each traced to one finding
The design explorations are deliberately not a monolithic system. Each is an independent, characterization-guided intervention, and each is evaluated against a workload-oblivious baseline.
Task-aware serving (§8.1) follows from finding (2). Tasks sharing the same component differ by orders of magnitude in input size, latency, and footprint; co-serving them in one worker pool causes head-of-line blocking. Task-disaggregated serving deploys each logical task — embed-query, embed-doc, llm-judge — as an independent service with dedicated resources. On Dynamic RAG at 0.5×, 0.7×, and 0.9× of peak throughput, this reduces average latency by 40%, 38%, and 29% respectively, against a component-sharing baseline with the same GPU count. The gain comes from mitigating queueing delay and interference, not from extra hardware.
Communication-aware placement (§8.2) addresses the problem disaggregation creates. Naively assigning each task type to a dedicated machine incurs prohibitive network overhead from moving massive intermediate state. Comparing three placements on multi-node RAG — co-none (each component on a dedicated server), co-vdb-embed (vector DB and embedding co-located), and co-all — co-locating the vector database with the embedding task reduces average latency by 2.8× under low load and 4.5× under high load. Profiling confirms the cause: network communication accounts for 67.5% of execution time in the co-none baseline and becomes negligible with co-location.
State offloading (§8.3) follows from finding (4). During each LLM planning call the sandbox is inactive and can be offloaded until the next tool step. Notably, the authors refuse to use context length as a duration predictor — they observe that total LLM latency remains variable because output length and appended input fluctuate across iterations, so they do not assume monotonic latency. The prototype instead triggers on elapsed time of the in-flight planning call. Result: 4.6× lower average memory and 2.1× lower peak memory, with latency increasing within 0.5%. The authors are careful to note these bars report aggregate resident memory across concurrently active sandbox processes, not a per-session peak — so they are not directly comparable to the headline 28 GB figure.
Tool-result caching (§8.4) follows from finding (6). A two-tier design caches exact query-to-result mappings and deduplicates URL fetches, requiring no change to the agent’s control logic. With a 10-minute TTL, the query cache eliminates 35.2% of redundant search calls in the search-based QA agent, saving 27 hours of aggregate search latency — 19.3% of the total.
Why this matters
The honest read is that this paper is doing for agentic serving what the early datacenter characterization papers did for warehouse-scale computing: establishing, with enough measurement rigor that it’s hard to dismiss, that the mental model everyone is optimizing against is wrong.
The practical consequence is a redirection of engineering effort. If you are building agent infrastructure and your roadmap is entirely GPU-side — better batching, better KV cache management, faster kernels — this paper says you are working on a component that accounts for a minority of latency in half your applications and a rounding error in the cost of your tool-heavy ones. The neglected work is sandbox lifecycle management, placement-aware scheduling, a first-class notion of a suspended-but-resumable session, and shared caching across sessions.
That last one is particularly striking. Cross-request redundancy at 67.3% of search calls is not a subtle effect — it is most of the external API bill, and it is structurally invisible to every per-session optimization, because no single session sees the repetition. It only shows up when you look at production traces in aggregate, which is exactly the kind of finding that justifies building a benchmark suite instead of publishing another point solution.
The obvious follow-up is a serving system that treats $\langle H, C, A \rangle$ as a runtime control surface rather than a deployment-time constant. Findings (3) and (4) together demand it: bottlenecks shift per-request, so static profiling is insufficient, and sessions transition between active and idle-but-live, so allocation must be dynamic. The authors explicitly frame their four explorations as evidence that gains are available, not as a finished design. Given that they commit to releasing AgentSysBench as open source, the interesting question is whether the community converges on a common agent-serving runtime the way it converged on vLLM and SGLang for inference — and whether that runtime ends up looking more like a container orchestrator than an inference engine.
Read alongside
- SWE-bench (Jimenez et al.) and OSWorld (Xie et al.) — the capability benchmarks this paper positions itself against; useful for seeing exactly what systems information they omit.
- vLLM / PagedAttention (Kwon et al., SOSP 2023) — the KV-cache management work whose assumptions this paper is testing at the session level rather than the request level.
- SGLang (Zheng et al.) — the structured-generation runtime used as the LLM engine in AgentSysBench’s stack.
- ReAct (Yao et al.) — the reasoning-and-acting loop that defines the control flow being measured here.
- “Architectural Implications of Agentic AI Workflows” (arXiv:2608.04458) — the Azure-fleet characterization covered in our 8 August digest; an excellent complement, since it looks at the same phenomenon from the hyperscaler’s fleet-telemetry vantage point rather than a controlled benchmark stack.
- Serverless cold-start literature (e.g. Catalyzer, SEUSS) — the snapshot/restore techniques the authors gesture at for sandbox lifecycle management.
Links
📄 arXiv abstract · 📄 PDF
Part of the Weekly CS Paper Digest series. Summary written from a close read of the preprint; figures cropped from the arXiv PDF and reproduced here under fair use for educational commentary.