Weekly Paper Notes — one of the top picks from the 2026-06-20 CS paper digest. Area: Distributed Computing.
Authors: Jiasheng Zhou, Longbin Zeng, Clavis Chen, Ruiming Lu et al. arXiv: 2606.20374 · PDF
TL;DR
ARGUS is a tracing and performance-diagnosis system designed for always-on operation on production LLM training clusters with more than 10,000 GPUs. The central insight is that no single profiler can be cheap, deep, and continuous all at once — so ARGUS decomposes observation along the training call hierarchy into three independent collection channels: CPU call stacks, framework semantics, and GPU kernel execution. Each channel is tuned for its own cost/granularity tradeoff and the channels are composable rather than substitutive — turning one off doesn’t break the others. The combined steady-state overhead stays below 2 %, well inside the budget that production teams will tolerate on six- to seven-figure-per-day fleets.
The harder problem is volume. A 10 k-GPU cluster generates 10⁴–10⁵ kernel events per minute per GPU — over 1 GB/min cluster-wide of raw traces. ARGUS introduces an online statistical compression scheme based on kernel-density-estimation (KDE) clustering that collapses each rank’s per-step kernel trace from ~10 MB down to ~2.7 KB — roughly 3,700× — without losing the structural information needed for cross-rank comparison. On top of this compressed pipeline a progressive diagnosis framework runs parallel detection at three granularities (iteration time → straggler rank → kernel distribution), funnelling tens of thousands of ranks down to single-digit suspects in minutes. It has been deployed in a 10 k+-GPU production cluster for over six months and the paper walks through five real-world fail-slow case studies it caught: compute stragglers, NIC link degradation, pipeline-bubble amplification, FlashAttention JIT stalls, and stragglers masked by communication symptoms.
What problem is the paper actually attacking?
LLM training at frontier scale is dominated by a peculiarly nasty failure mode: fail-slow, not fail-stop. A handful of ranks, GPUs, or NIC links don’t crash — they just become a few percent slower than their peers, and because gradient sync is barrier-synchronous, the whole iteration runs at the speed of the slowest rank. Multiplied across tens of thousands of GPUs and thousands of iterations per day, a 5 % drag is a six-figure daily compute bill.
The state of the art splits roughly into two camps that ARGUS positions itself between:
- Coarse resource monitors (DCGM, Prometheus exporters, node-level GPU-util curves) are cheap and always-on but only tell you that a rank is slow, not why. They can’t distinguish a slow kernel from blocked communication, a Python GC pause, a stalled dataloader, or a JIT recompile.
- Fine-grained profilers (Nsight Systems, PyTorch Profiler, HTA, Megatron’s built-in timeline) give you everything but cost 5–30 % overhead and produce trace volumes that are infeasible to keep on always. So they’re used reactively — someone notices throughput dropped, files a ticket, and an SRE turns the profiler on for a few minutes. By then the intermittent fault may already be gone.
The motivating observation is that the call hierarchy of a modern training stack (Python scheduling → framework forward/backward/optimizer/comm → GPU kernel runtime) has natural decomposition points. Each layer can be observed with a different mechanism whose cost and selectivity are tuned to that layer alone. You don’t need to push a single profiler down all three layers and pay 30 % to do it — you can pay 0.5 % to instrument framework semantics, ~0.3 % to sample CPU stacks, and ~1 % to capture kernel events, and compose them.
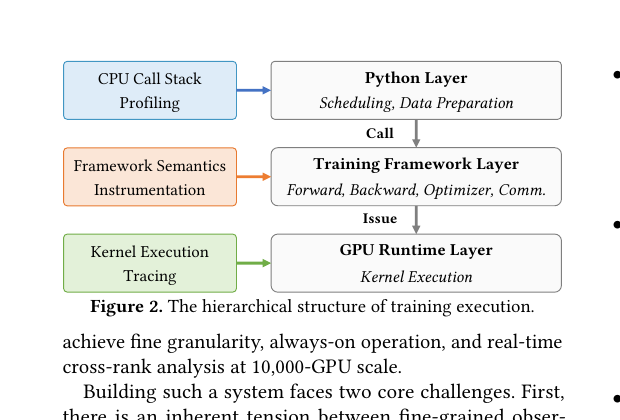 Source: Zhou et al. — arXiv:2606.20374, Figure 2.
The mechanism: three channels, one pipeline, progressive diagnosis
The three collection channels are independent processes with independent buffers:
- CPU call-stack profiling — periodic sampling of Python and C++ frames, giving a low-overhead view of the host side (data loader, scheduling, GC, JIT). This is the cheapest channel and runs at the highest sampling rate.
- Framework semantics instrumentation — explicit hooks inserted at phase boundaries (forward, backward, optimizer step, all-reduce, pipeline send/recv). This produces a small number of high-information events per iteration and is what powers iteration-time and phase-level analysis.
- Kernel-execution tracing — captures every GPU kernel launch with timing and stream metadata. This is the firehose: 10⁴–10⁵ events/minute/GPU.
The kernel firehose is what makes always-on tracing hard at scale, and it’s where the paper’s key engineering contribution lives. Rather than ship raw kernel events anywhere, each rank runs an online KDE-clustering compressor: kernels are bucketed by name and stream, and for each bucket the distribution of durations within a time window is summarised by a small set of kernel-density modes plus their weights. Reconstruction is lossy by design — you can no longer point at the slow kernel invocation — but cross-rank statistical comparison (is rank-417’s kernel-X distribution the same as the cluster mean?) remains exact at the distribution level. The compression ratio is ~3,700× (10 MB → 2.7 KB per rank per step), which is what gets the always-on number under 2 %.
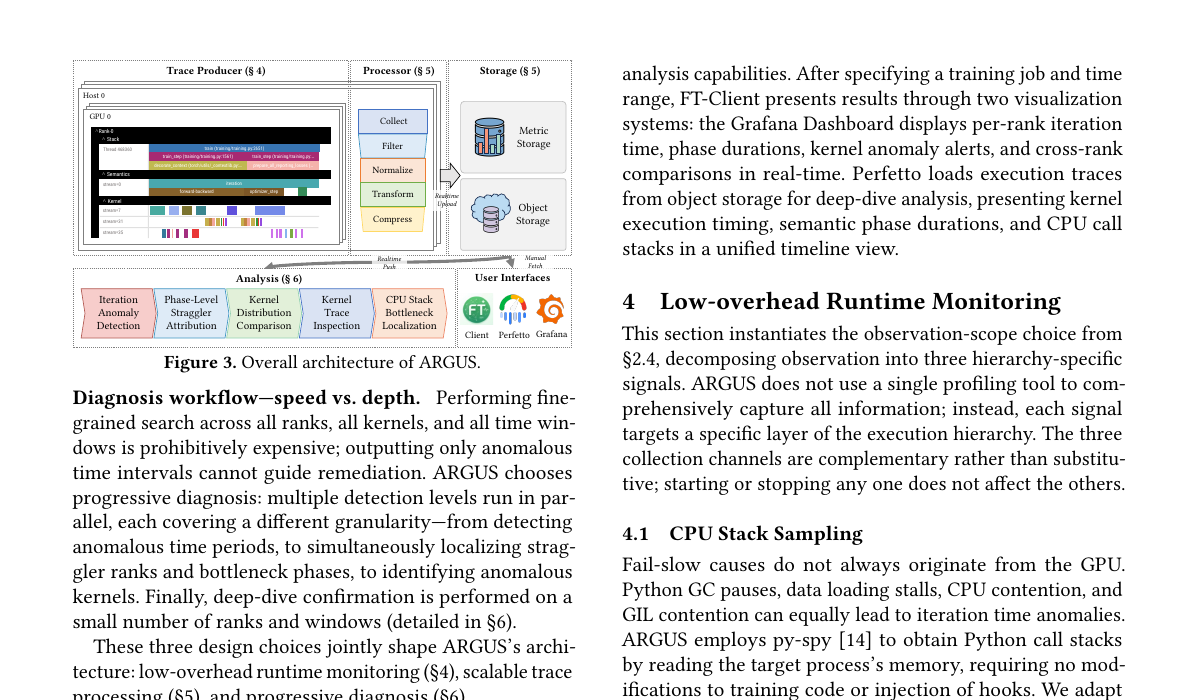
 Source: Zhou et al. — arXiv:2606.20374, Figure 3.
The diagnosis side is the second piece. ARGUS doesn’t try to answer “what’s wrong?” with a single classifier; it runs four detectors in parallel at decreasing granularity:
- Iteration-time anomaly detection — does the cluster’s iteration time deviate from baseline?
- Phase-level straggler attribution — which phase (forward / backward / all-reduce / optimizer) widened, and on which ranks?
- Kernel-distribution comparison — for the implicated phase + ranks, which kernels’ distributions diverged from the cluster mean?
- CPU-stack bottleneck localization — for ranks where kernels look fine but the host is stalled, which Python/C++ frame is on the critical path?
Each detector narrows the suspect set; together they take the operator from “iteration time jumped” to “ranks 4172, 4173, 4180 — FlashAttention forward kernel mode shifted 12 % rightward — JIT recompile triggered on rank 4172, propagated via pipeline bubbles.”
Why training stays fast (the practical claim)
The < 2 % overhead claim is the load-bearing one — without it nobody will run the system always-on. The paper breaks the budget down: framework instrumentation adds ~0.3 %, CPU stack sampling adds ~0.4 %, kernel tracing pre-compression is the biggest at ~1.1 %, and pipeline upload (compressed metrics + tiered storage to object storage) is sub-0.1 %. The KDE compressor runs in-process per rank and is itself bounded by the kernel event rate, so it scales linearly with workload and not cluster size.
Crucially, none of the three channels requires modifying the model code. Framework hooks live inside Megatron / FSDP / ZeRO patches; kernel tracing piggybacks on CUDA event APIs; CPU stack profiling is a sidecar. This means ARGUS works on the unmodified production stack — a non-trivial requirement, because production training jobs aren’t going to take a patch from an observability team just to be measured.
Results
The paper’s evaluation is unusual for a tracing system in that it leans heavily on the six-month production deployment rather than synthetic microbenchmarks. The five case studies in §7-§8 are the headline:
- Compute stragglers — a small set of GPUs running ~7 % slower than peers, surfaced via phase-level straggler attribution and confirmed at kernel-distribution level. Root cause: silent SM throttling on a hardware revision.
- NIC link degradation — intermittent all-reduce slowdowns localized to specific NIC ports. Surfaced by phase attribution; coarse monitors had not flagged the underlying ports as degraded.
- Pipeline bubble amplification — a slow rank propagating bubbles through pipeline-parallel stages; ARGUS attributed the bubble back to the source rank instead of the downstream symptom ranks.
- FlashAttention JIT stalls — recompilation on first-encounter input shapes blocked the host; CPU stack profiling localized to the Triton compile path.
- Stragglers masked by communication — slow compute kernels disguised as comm slowdowns; the kernel-distribution detector caught the actual compute regression that the phase view had wrongly attributed to all-reduce.
The compression numbers are the other key result: ~3,700× on kernel traces, with reconstruction error on cross-rank percentile statistics under 2 %. Without compression the pipeline could not sustain always-on operation at 10 k-GPU scale.
Why this matters
ARGUS is a worked example of a pattern that has become unavoidable in frontier-scale ML systems: the observability stack has to be co-designed with the workload, because off-the-shelf tracing assumed a world where overhead-cost was decoupled from compute-cost. On a 10 k-GPU job at frontier-model prices, 5 % overhead and 1 % cluster reliability are economically equivalent — both cost roughly the same per day — so the observability budget has to be set against the same dollar number as the unreliability budget, not against the “what’s tolerable in a microservice” intuition that profilers grew up with.
The three-channel decomposition is the transferable idea. The same shape — independent channels, each tuned to its layer’s natural granularity, fused only at the analysis layer — applies cleanly to inference serving (request scheduling, KV-cache management, kernel execution), to large distributed databases (query planner, storage engine, network), and to multi-tenant accelerator pools. The KDE-compression trick is more specific to high-volume time-series telemetry, but it’s the right answer whenever per-event detail is uninteresting and only the distribution matters for cross-instance comparison.
What’s likely to come next is automated remediation rather than diagnosis. ARGUS narrows root cause to single-digit suspects; the natural follow-up is for the cluster scheduler to act on that — drain a degraded NIC, defer a JIT compile, rebalance pipeline stages — without an operator in the loop. The paper hints at this but doesn’t claim it.
Read alongside
- Megatron-LM (Shoeybi et al., 2019) — the training framework whose hooks ARGUS instruments.
- HTA: Holistic Trace Analysis (Meta, 2023) — earlier work on PyTorch trace post-processing; ARGUS replaces the reactive workflow with an always-on one.
- Strobelight / Magic Pocket diagnosis (Facebook, 2019) — production stack-sampling profilers; ARGUS borrows the always-on / low-overhead philosophy and adapts it to GPU trace volumes.
- Megascale (ByteDance, 2024) and the Llama 3 training log (Meta, 2024) — both motivate the fail-slow problem with concrete numbers from frontier-scale training.
Links
📄 arXiv abstract · 📄 PDF
Part of the Weekly CS Paper Digest series. Summary written from a close read of the preprint; figures cropped from the arXiv PDF and reproduced here under fair use for educational commentary.